Caspy Analysis#
Caspy reads completed MPPT results and produces tables, energy diagrams and transition spectra. It does not rerun the electronic-structure calculation.
WIP: the interaction interface will change. Commands and options below describe the current version.
What It Produces#
State energies, angular properties and oscillator strengths.
Orbital-character weights and dominant determinant/configuration tables.
Energy-level diagrams, with optional clustering and degeneracy labels.
State-1 E1 line-strength and oscillator-strength spectra: sticks and broadened curves.
Grouped energy/occupation tables in CSV, formatted text or XLSX.
Install#
Complete the MPPT installation, activate its environment, then run from the source root:
python -m pip install --no-cache-dir ./caspy
Managed --heffso-report requires a regular installed Caspy package. Editable
or source-shadowed installations are rejected by managed report validation.
Use caspy-heffso-report for the report bundle and analyze_mppt for log-based
analysis. The bare caspy command is a separate Fortran-source utility.
Generate A Report With The Calculation#
Enable HEFFSO and its properties in your calculation input. This fragment assumes the rest of the scientific workflow is already configured:
mppt:
  prefix: Ce
  heffso:
    enabled: true
    properties: true
pyscf2mppt input.yaml --output-dir runs/ce --heffso-report
The report is part of managed completion and its files are included in the
artifact inventory. --heffso-report cannot be combined with --stop-after.
Generate A Report From Existing Results#
caspy-heffso-report --run-dir runs/ce --prefix Ce
The prefix must match the calculation. Caspy reads paths from run.json when
present; otherwise it uses the standard output layout.
Required inputs:
Shared integral HDF5, including final orbital-analysis metadata.
DIAGPT handoff:
data/Ce_heffso.h5.HEFFSO properties schema v4:
data/Ce_heffso_properties.h5.HEFFSO process log:
logs/heffso.log.Occupation and configuration logs under
reports/heffso/.
Caspy checks dimensions, determinant identities, orbital maps, energies and property consistency before writing the bundle. A validation error returns exit code 2. A properties-disabled run is insufficient for this report; an energy diagram from the text log remains available.
Magnetic tables and plots#
caspy-heffso-report --run-dir runs/ce --prefix Ce --magnetic
Caspy exports the native g values, field levels, magnetization and susceptibility from the completed HEFFSO result. These magnetic properties use the magnetic-moment operator at zeroth order in the MPPT perturbation, projected into retained states. Caspy does not change that approximation or recalculate the field/temperature grid. See Magnetic Properties for formulas, applicability and output filenames.
Output Files#
reports/heffso/
├── Ce_state_properties.csv                  — energies, angular values, strengths
├── Ce_orbital_character.csv                 — projector weights and assignments
├── Ce_dominant_configurations.csv           — coefficients and occupations
├── Ce_properties_summary.md                 — bounded summary and diagnostics
├── Ce_line_strength_stick_spectrum.png
├── Ce_line_strength_broadened_spectrum.png
├── Ce_oscillator_strength_stick_spectrum.png
└── Ce_oscillator_strength_broadened_spectrum.png
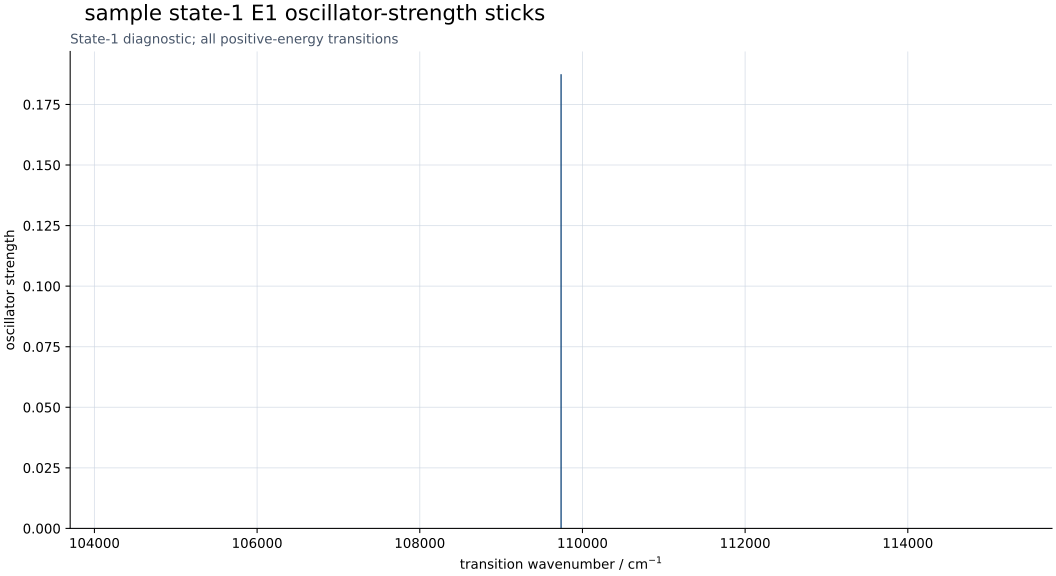
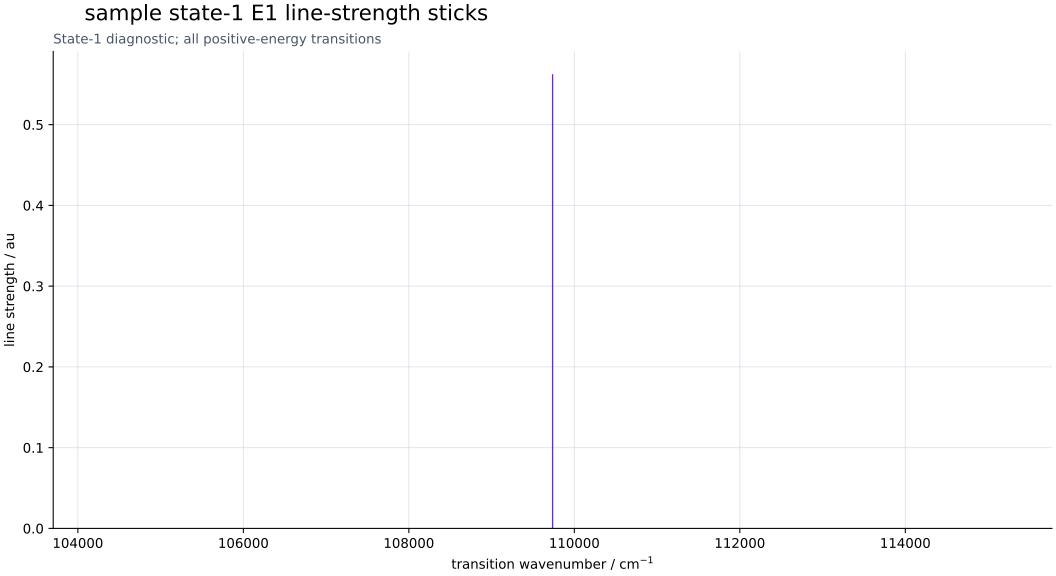
The two strength definitions differ: line strength is the Cartesian dipole matrix-element norm; oscillator strength also includes transition energy. All four plots use positive-energy transitions from state 1.
Controls#
caspy-heffso-report --run-dir runs/ce --prefix Ce \
  --output-dir reports/ce-review --top 20 \
  --spectrum-profile lorentzian --spectrum-fwhm-cm-1 200
Option |
Meaning |
|---|---|
|
Separate destination; default is |
|
Strongest transitions shown in Markdown, default 20. Does not truncate plots or CSVs. |
|
|
|
Positive broadening width in cm⁻¹, default 100. |
|
Orbital-assignment thresholds, defaults 0.10 and 0.05. |
Orbital assignments are assigned, mixed or unassigned; raw weights are
retained. Labels describe projector overlap, not certified atomic terms.
For a nonstandard directory, override input paths with --shared-hdf5,
--handoff-hdf5, --properties-hdf5, --primary-log, --occupancy-log and
--configuration-log. Relative paths are resolved below --run-dir.
Energy Diagrams#
Display a diagram from the HEFFSO log:
analyze_mppt runs/ce/logs/heffso.log
Use the Python API to save a figure, select units or group levels:
from caspy import analyse_mppt

result = analyse_mppt.analyse_mppt(
    "runs/ce/logs/heffso.log",
    occupancy_source="runs/ce/reports/heffso/Ce_heffso_occupancy_analysis.log",
    energy_unit="cm",
    figure_path="ce-levels.svg",
    show=False,
    show_degeneracy=True,
    degeneracy_tol=1.0,
)
Units: ev, cm or hartree, relative to the lowest state. degeneracy_tol
uses the selected unit. Set clusterise=True, num_clusters=2 (or 3) to group
energy ranges. Returned data include parsed rows, energies and Matplotlib objects.
The current parser supports HEFFSO energy tables; it is not a general DIAGPT
log parser.
Grouped Energy And Occupation Tables#
For a run with at least four states, average two specified state groups:
analyze_mppt runs/ce/logs/heffso.log \
  --occupancy-log runs/ce/reports/heffso/Ce_heffso_occupancy_analysis.log \
  --recalculate-energies --blocks "1-2;3-4" --format csv --output levels.csv
--blocks "1-2;3-4": explicit one-based state groups.--blocks-sizes "2,2": consecutive groups by size.--blocks each-line: one group per printed state row;lines: split by blank lines.--format csv|fmt|xlsx: CSV, aligned text or Excel; XLSX requires--output.--group-orbitals "4f:7,5d:5": sum consecutive occupation columns into named groups. This assumes the logged column order actually has those groups.
--recalculate-energies computes block barycentres from existing results; it does
not run MPPT again. To annotate a log with grouped occupations instead, use
--annotate-log --group-orbitals ... with the occupation log.
Plot Examples#
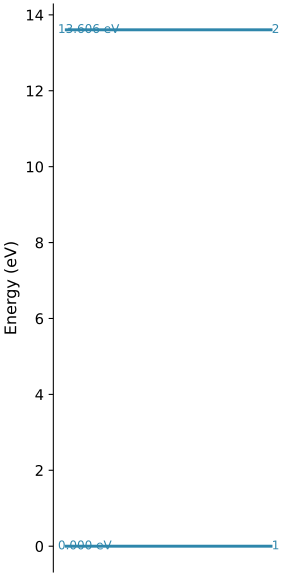
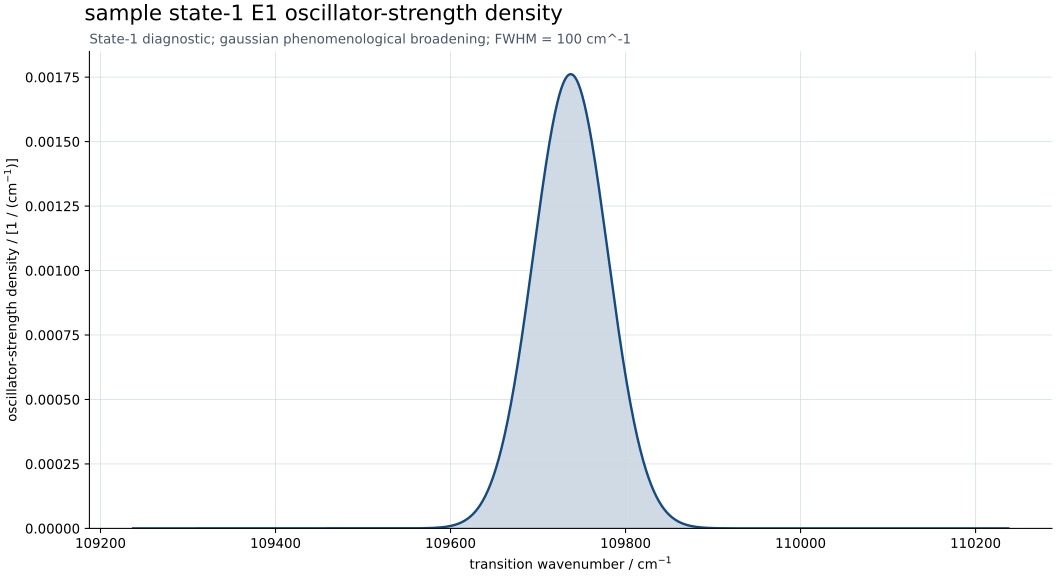
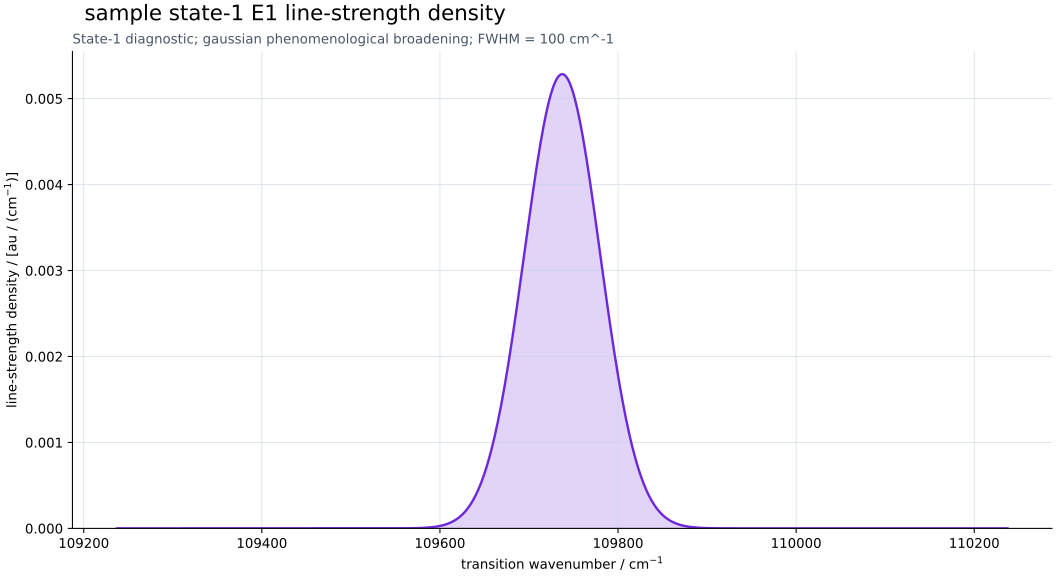
These figures use the included two-state test fixture, not a molecular prediction: a 0.5-Hartree excitation with dipole matrix element 0.75 a.u. The energy diagram and spectra are rendered by Caspy’s normal plotting code.
The same report also produces line-strength sticks and a broadened line-strength curve. Inspect the example state table, orbital table and configuration table.
Read Results In Python#
from caspy import read_heffso_properties

properties = read_heffso_properties("runs/ce/data/Ce_heffso_properties.h5")
print(properties.state_energy_hartree)
print(properties.oscillator_strength)
print(properties.dipole_matrix[:, 0, 1])
print(properties.solver.root_residual_norm_hartree)
For the complete bundle API, use caspy.heffso_report.generate_heffso_report();
its keyword options mirror the report CLI. Full matrix definitions remain in
the HEFFSO output contract.
Interpretation And Limits#
Spectrum broadening is phenomenological and area-normalized. It does not model temperature populations, concentration, measured linewidths or an instrument response.
The report does not assign atomic term symbols or certify multiplets.
An angular-commutator status
OPENcan reflect an incomplete retained state space; inspect the stored residuals and state span.The log-based analyzer warns about unconverged HEFFSO output; the stricter report bundle validates its input artifacts before rendering.
Archive the original HDF5 and logs with exported reports. Caspy is WIP; its user interface will change in future versions.